

How can we help you?
Analyze the performance of your variants
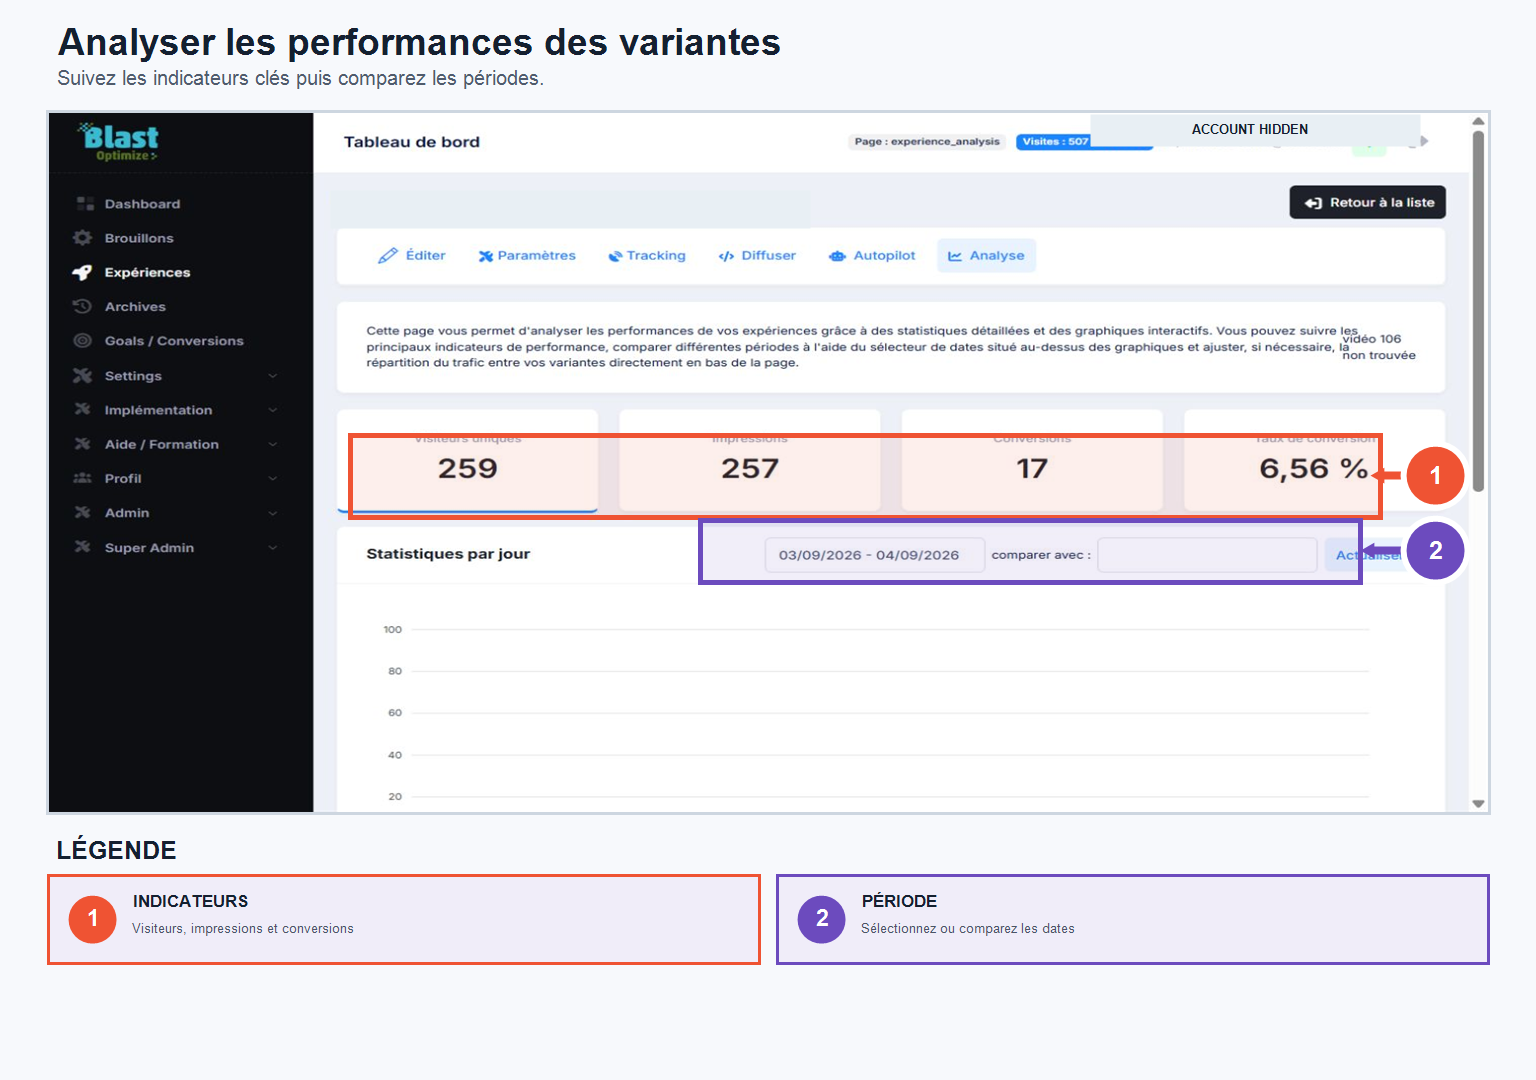
The tab Analysis Your experience displays the main indicators: unique visitors, impressions, conversions and conversion rate (CVR).
Available features:
- Select one analysis period (start date / end date).
- Comparing two periods between them — useful after a modification to quickly see its impact.
- Show or hide certain variations to focus on those that interest you.
- Choose the metrics to be displayed in the graphs (impressions, conversions, conversion rate, etc.).
- Directly modify traffic distribution between variants from the Analysis tab, without going back through the experiment settings (the total of all variants must always equal 100%; otherwise BlastOptimize indicates that the configuration is not valid).
This tab also keeps a history of the experience: variants, modifications made and performance evolution over time.
Modify an experience without recreating it
From the analytics interface, you can adjust an existing experience without starting from scratch. Depending on your configuration, it's possible to modify the rotation, replace a landing page, or directly adapt the original page.
This flexibility is useful when you want to keep the test history or maintain a low percentage of traffic to the original landing page, for example in certain Google Ads or Matomo setups.
Recommended checks after a modification
- Check the new URLs and distribution ratios.
- Control the tracking on each variant.
- Review the analysis after receiving new visits.