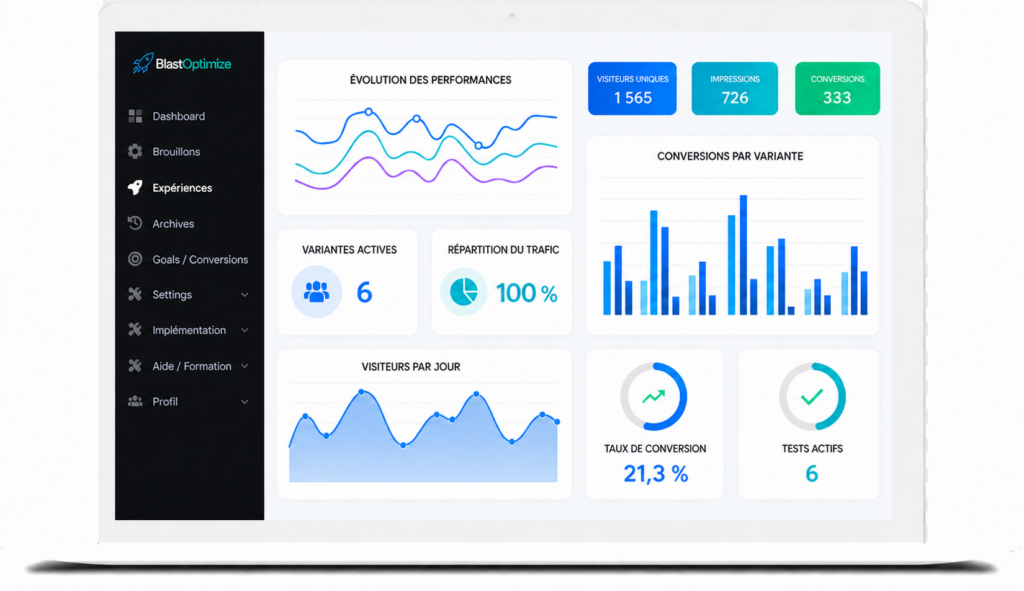
Track your tests and customizations from a centralized, clear and free dashboard.
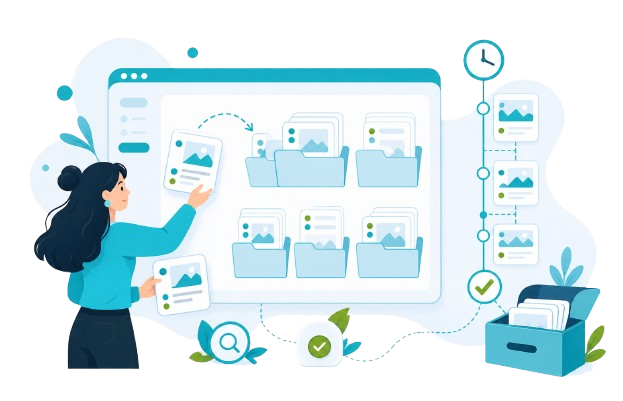
Find all your active and past experiences in one place.
Explore the results of each experiment in detail.
Share your results with your team or clients.
Check the performance of your experiments without waiting for the test to finish.
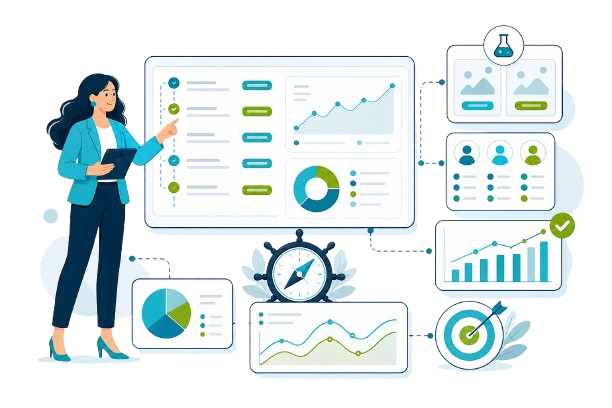
Analyze your results by audience segment.
Export your results for analysis in your own tools.
Stay informed about important developments in your experiences.
Yes, the dashboard centralizes all of your active experiences.
Yes, you can track the performance of your experiments without waiting for the test to finish.
Yes, the results can be exported for analysis in your own tools.
Yes, the reports can be shared according to your needs.